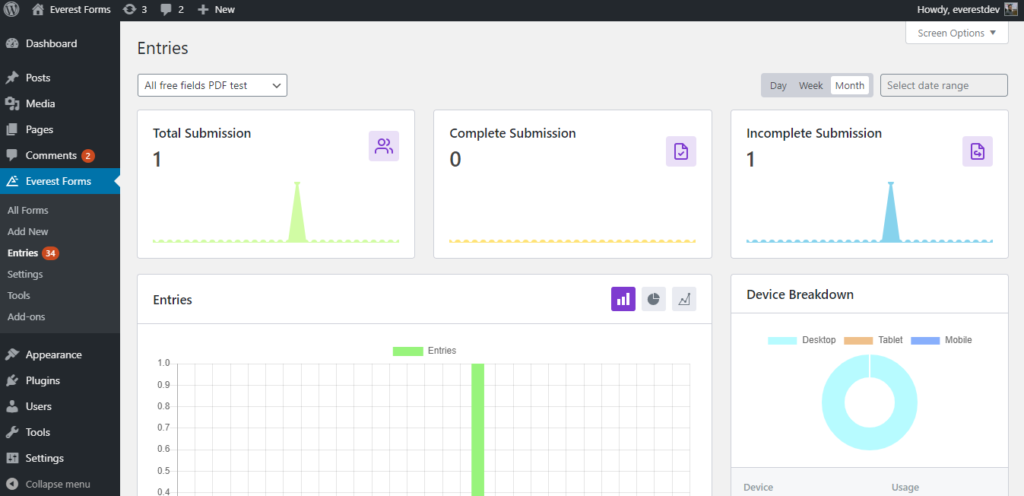
With the Everest Forms Pro add-on, now you have the option to view the analytics of your form entries in a Graphical Representation. The New Dashboard Analytics Feature delivers the statistics of your form entries in an organized way. You will be able to see the data for each form as per your choice in the selected time frame.
Go to Everest Forms > Entries, Select the form whose data you want to see and you will be presented with a clean and informative dashboard as in the screenshot below.
Let me tell you in detail about everything that’s in the Dashboard.
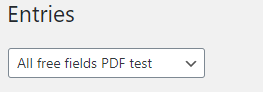
- Form Selection Dropdown: On the top left of the dashboard, you will see a dropdown option where you can select from different contact forms made with this plugin and see the data of that specific form.
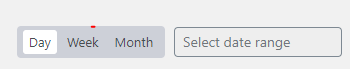
- Day | Week | Month | Date Range: On the top right of the Dashboard, you will see the time frame selected, of which the entry data is being shown. By default, the data will be shown for the month. You can click on any option to see the data as per your requirement. You can click on Day to see today’s data. You can click on Week to see the data of the week. And you can click on the “Select Date Range” to select a starting date and an ending date to see the data of that particular selection.
Overall, what it means is, that you can see the entry data of your contact forms at whatever timeframe you want. - Total Submission | Complete Submission | Incomplete Submission: In the Above Analytics, you can see three sections that show the numeric count of your form entries.
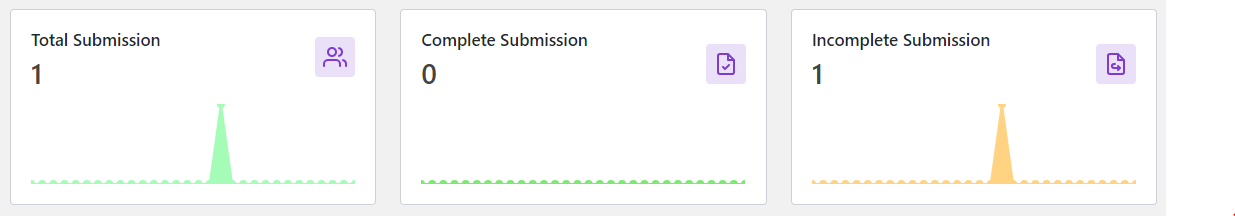
—Total Submission: It will show you the total number of form submissions that have been made through this form on the selected time frame.
—Complete Submission: It will show you the total number of completed form submissions that have been made through this form in the selected time frame.
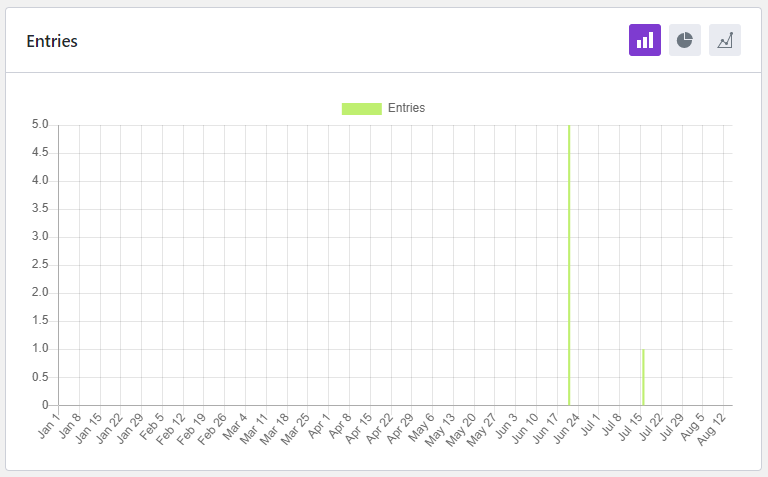
—Incomplete Submission: It will show you the total number of incompleted form submissions that have been made through this form in the selected time frame. - Entries: This section of the Dashboard Analytics shows you the Graphical Representation of the form entries. Interestingly, you can change the nature of graph at your convenience. You can switch to a pie chart or line graph if you want the graph to display differently. You can do this by clicking the pie icon or line icon inside the Entries Graph.
- Device Breakdown: This section of the Dashboard beautifully shows you which device was used to submit the Form.
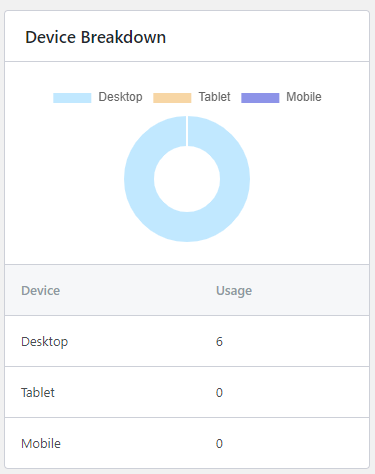
In this section, you will get the number count for Desktop, Tablet, and Mobile Devices.
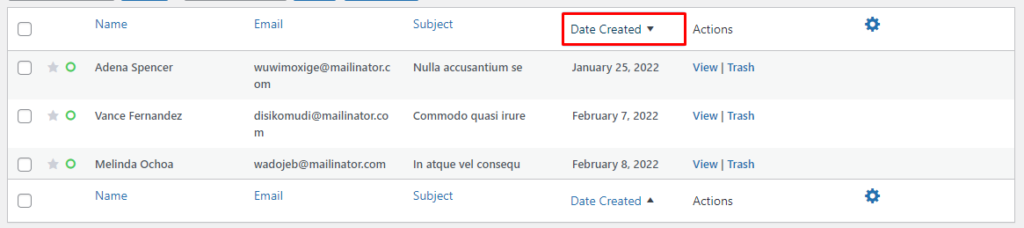
NOTE: You can sort the entries by clicking on the column titles. For example, if you click on the ‘Date Created’, the entries will be sorted in ascending/descending order.